Andréa Rossi Scalco[1]
Gregory A. Baker[2]
Value capture analysis of small organic growers and their distribution channels in California
Introduction
According to 2012 survey data on certified organic agriculture (FIBL-IFOAM, 2012), organic agriculture has increasingly expanded worldwide, with approximately 37.5 million hectares under cultivation by 1.9 million farmers in 164 different countries. Relative to 2008, the cultivated area grew by 7.1% with a 35.7% increase in the number of farmers worldwide (FIBL-IFOAM, 2010; 2014).
The US, which began certifying organic growers in 2001, has recorded some of the strongest growth in terms of arable land and the value of the organic products market. The US is the world’s largest organic market as measured by retail value and the third largest country by value of production. Between 2000 and 2008, the US showed market growth in the amount of €15 million, whereas the European Union as a whole showed growth of €15.6 million in the same period (WILLER; HELGA; KICHER, 2010).
Organic farms in the United States sold a total of $5.5 billion in organic products in 2014 (CENSUS, 2014). The US state of California is one of the most important states for organic agriculture accounting for 41% of the country’s total cultivated area for organic products (OBERHOLTZER; DIMITRI; GREENE, 2008). From 2002 to 2012, California experienced 240% growth in the number of certified organic growers (USDA, 2012). In terms of sales volume, California represents 40% of all organic product sales in the US. It ranks first, with sales of $2.2 billion, followed by the state of Washington, with $515 million (CENSUS, 2014).
The 2008 Organic Production Survey (OPS), administered by the National Agricultural Statistics Service, was a follow-up to the 2007 Census of Agriculture and was the first survey of organic agriculture in the United States (KLONSKY, 2010). According to this survey, California leads the nation in terms of the number of organic farms, the land used in organic production, and organic sales. Overall, California represents 19% of all organic farms and over one-third of all organic farmgate sales derived from California farms came from just 12% of the organic acres and 19% of the organic farms. These numbers suggest either a concentration in production among larger growers or a focus on high-value crops by some growers. Conversely, there appears to be a large number of small organic farms. By crop category, California produces more than two-thirds of organic fruits, vegetables, and nuts in the entire country.
According to the 2012 Census of Agriculture (CENSUS, 2014) 63% of US organic farms reported selling products to wholesale markets. These sales accounted for 78% of U.S. organic farm sales. Wholesale markets, such as buyers for supermarkets, processors, distributors, packers, and cooperatives, served as the marketing channel of choice for U.S. organic farmers to provide organic agricultural products to customers (CENSUS, 2014). However, according to Forshungsinstitut für biologischen Landbau – International Foundation for Organic Agriculture - Fibl-Ifoam (2015), organic producers were much more likely to report direct-to-consumer sales than were conventional producers. Although 7% of all U.S. conventional farms sold agricultural products directly to consumers, 42% of organic farms reported such sales.
The international literature on organic products indicates that the production and distribution characteristics of organic and conventional agriculture are relatively similar. However, organic agriculture has traditionally been especially important for small farmers and producers because it favors their entry into the global market and provides opportunities for enhancing income, despite the small scale (GONZÁLEZ; NIGH, 2005; VORLEY; FOX, 2004; ELDER; LISTER; DAUVERGNE, 2014).
The decision regarding which channels to access, as well as the most appropriate governance structure for commercial transactions, is an extremely important issue for organic producers. As they strive to maximize profits they must consider the revenue implications of channel choice as well as the costs associated with business transactions and investments required for the different channels. In this research, we apply transaction Cost Economics (TCE) theory, which assumes that the choice of the most appropriate channel and governance structure adopted leads to a reduction in transaction costs and consequently greater business efficiency (WILLIAMSON, 1985).
The objective of this research is to study the transactions (producer-buyer) in the distribution channels of small, rural fruit and vegetable organic producers. We identify producers’ perceptions of the potential to capture value in these relationships and identify which channels offer the greatest opportunity to capture value for the various products based on the principal channels utilized by organic producers. We begin by classifying the sales channels as either direct or indirect channels and then describe in detail the sales channels that are used by US organic producers. The following section introduces TCE theory, which serves as support for the data analysis with an emphasis on the specific characteristics of assets used in transactions between the producer and the buyer. In the following sections we present the methods used for data collection and analysis followed by the presentation of the data, data analysis, and discussion of the results. We conclude with a summary of the study’s principal findings.
Distribution channels for organic products
The number of intermediary levels that separate the producer from the end consumer defines the length of a distribution channel. For this reason, distribution channels are characterized as either short or long. The length of a distribution channel, whether short or long, is a key determinant of process efficiency, specialization and division of labor, contractual efficiency aimed at reducing transaction costs, and the ease of searching for suppliers and customers (STERN et al., 1996; ROSEMBLOOM, 1999).
It is generally assumed that greater proximity to the end consumer leads to greater consumer understanding of aspects related to the product’s "value". Short channels might therefore be more suitable than long channels for promoting organic foods, given that certification alone cannot convey all of their attributes to the end consumer. For example, in addition to products produced with no pesticides, other attributes, such as environmental and social attributes, may be most easily conveyed through short channels.
Channel levels for farm products vary greatly according to product type and region and involve many other commercial agents, such as processors, distributors, among others. Nonetheless, we can classify the fresh organic fruit and vegetable distribution channels as either direct or indirect. With direct channels, products are sold directly to the consumer. Direct channels include farmers’ markets, farmstands, and community supported agriculture (CSA). With indirect channels, the products are channeled to the end consumer through the use of intermediaries. Retailers include local supermarkets, health food stores, and restaurants, whereas intermediaries include distributors, processors, and packers.
According to Fibl-Ifoam (2015), organic producers are much more likely to report direct-to-consumer sales than conventional producers. Although 7% of all U.S. farms sell agricultural products directly to consumers, 42% organic farms report such sales. Studies indicate that the use of direct channels provides an increase in the income of small rural producers. According to Wang, Moustier, and Loc (2014), the direct distribution channels used by fresh vegetable producers in Vietnam have increased the income of small producers. According to Giuca (2013), selling products through short channels, and specifically direct channels, promotes an improvement in the producer’s income because it reduces the producer’s fuel consumption costs, need to refrigerate products, and packaging costs and promotes proximity to the consumer, who values the product’s intangible attributes, such as its production systems and territorial development.
Although a higher percentage of organic producers sell through direct sales channels than conventional producers, a large proportion of organic producers still use indirect sales to distribute their products. The most common channel for organic producers is restaurants and/or intermediaries (70%), followed by farmers’ markets (62%), Community Supported Agriculture (CSA) (45%), farmstand sales (44%), wholesalers (44%), and direct sales to institutions (20%) (CANTOR; STRICHILIC, 2009).
Transaction Cost Economics and Value Capture
In addition to choosing the most appropriate channels for distributing their products, producers must adopt appropriate sales mechanisms that contribute to the competitiveness and efficiency of their transactions. The theoretical framework for understanding efficiency in producer-customer transactions is Transaction Cost Economics, commonly referred to as TCE. TCE is a theoretical approach to analyzing forms of governance, and it has two aspects. One aspect is governance, advanced by Williamson (1985); the other aspect is the measurement cost, advanced by Barzel (1982).
TCE theory indicates that individuals use appropriate mechanisms, called "governance structures," to regulate a given transaction to reduce transaction costs. Taking the transaction as the unit of analysis, TCE seeks to control ownership rights by aligning governance structures (sales mechanisms), transaction characteristics (frequency, uncertainty, and asset specificity), and agent characteristics (bounded rationality and opportunism).
No governance structure is inherently superior to any other; the aim is to align governance structures with the transaction characteristics, which are frequency (repeat transactions that lead to an increase in reputation), uncertainty (ignorance of the future value of variables that are key to the business’s success), and asset specificity (the degree to which an asset used in a transaction has greater value in one transaction than it would in another) (ZYLBERSZTAJN; NEVES, 2000; FURQUIM, 2000; AGUIAR, 2010). Transaction costs are higher or lower depending on the characteristics of the transaction.
According to Williamson (1985), asset specificity is the most important characteristic for determining the most appropriate governance structures, which are market, hybrid (contracts), or hierarchical (WILLIAMSON, 1985). Greater asset specificity leads to more complex structures, starting with market as the simplest structure and followed by hybrid or hierarchical.
Williamson (1985) categorizes asset types as follows:
- Locational refers to the proximity between the agents who are involved in the transactions. Proximity between agents in the chain leads to lower transportation costs;
- Temporal refers to the time that is required to complete the transaction. Because fruit and vegetable organic products are highly perishable, such assets have greater asset specificity;
- Human capital refers to the impact of human capital in terms of specialized knowledge;
- Physical refers to the assets that are involved in the production of the traded product, such as machines, which may be more or less specific;
- Technological refers to the extent that completing the transaction involves investing in more sophisticated technologies whose return depends on the transaction with a particular agent; and
- brand refers to brand-building efforts.
An asset is said to be specific when it has a very low value in an alternative use. For Farina et al. (1997), specific assets are those considered to be reusable unless there is a loss in value, which makes investments in these types of assets subject to risk. In this sense, in a transaction in which an agent makes a large investment in an asset, it becomes specific due to the loss that is associated with an opportunistic action by another agent. Specific assets can thus be defined as those in which there is a loss in the value of the assets involved if the transaction does not materialize because no other alternative use that maintains the asset’s value can be found.
Agents in transactions are subject to opportunistic attitudes. This phenomenon is based on the assumption that agents do not have all of the necessary information, either before or after negotiations. For Azevedo (2000), adopting an inappropriate sales mechanism means damaging the company, even if it is competitive in terms of efficiency. Thus, it can be concluded that a company’s efficiency is not limited only to productive efficiency but rather to the efficient sales of its inputs and products.
TCE’s main contribution is to enable an analysis of efficiency in transactions between agents and signal that the more appropriate the coordination between suppliers and customers is, the lower the transaction costs, the fewer the relationship conflicts between the customer and the supplier, and the greater the value capture for the agent who made the investments.
If an agent decides to make large investments in the production of a good and engage in an exchange with another agent in a manner that opportunistically appropriates the potential value of the exchange, then the transaction costs grow because the first agent must create safeguards against the second agent (SOUZA, 2002).
According to Cunha, Saes, and Mainville (2013), the establishment of formal and informal contracts involves the exchange of ownership rights. Individuals only make exchanges when they receive more than what they have. For example, in the marketing of organic products, both the producer expects to receive a better price for his product, and the buyer expects the organic product to be in fact "organic".
Therefore, ownership rights should be well established to avoid value capture in which the owner does not receive the total dividends of the exchange because this amount is held by the other party (CUNHA; SAES; MAINVILLE, 2013).
In this sense, Saes (2008) analyzes different types of differentiation strategies and the possibility of value capture for small rural producers. We note that differentiation does not guarantee that the producer will capture value from investments made in the activity but rather that the consumer will actually understand the producer’s importance to the final product. The production of organic products is an example of a differentiation strategy by a producer who invests in handling techniques to satisfy the social and environmental particularities of the organic production system, which are often not recognized by the consumer (GUIVANT, 2003; KRISCHKE; TOMIELLO, 2009; BRAGA JUNIOR et al., 2013a; BRAGA JUNIOR; SILVA, 2013).
Thus, according to Saes (2007), the existence of a specific asset creates a quasi-rent, which is the difference between the value that is generated in the specific activity and its best alternative use. As in commercial relationships, it is impossible to predict ex ante the division of the surplus (quasi-rent). Conflicts may arise among the agents and, because the surplus is often large, it may remain in the hands of the agent who did not make the largest investments due to their opportunistic behavior (KLEIN et al., 1978).
The problem of determining the division of the quasi-rent is present because of the difficulty of determining the ownership of residual rights to the income generated. An efficient transaction should ensure that the agent who invests in a specific asset retains the residual ownership rights as a means of giving continuity to a specific investment (SAES, 2007).
A USDA Report (USDA, 2009) indicates that one of the barriers to small and medium-size U.S. farmers selling organic products is access to new markets because 41% of producers end up selling organic products as conventional and thus the residual income does not remain with the producer.
Given this theoretical contextualization, the objective of this research is to study the transactions (producer-buyer) in the main distribution channels of small rural fruit and vegetable organic producers to identify whether there is asset specificity in these transactions and, given the investments made in these transactions, to identify whether the ownership rights remain with the producer or the buyer.
Methods
This is an exploratory study that uses a qualitative approach. According to Gil (p. 43, 1999), “exploratory research aims to develop, clarify, and modify concepts and ideas to formulate more precise problems or researchable hypotheses for further studies.” They typically involve bibliographic and document surveys, non-standardized interviews, and case studies. “Studies that use a qualitative methodology may describe the complexity of a given problem, analyze the interaction of certain variables, understand and classify dynamic processes experienced by social groups, contribute to the change process of a particular group, and enable a deeper understanding of the particularities of individual behavior” (richardson, 2008).
The case study method was used. This method makes it possible to conduct a thorough study of the research object, provide an overview of the problem, and identify possible factors that influence or are influenced by it (GIL, 1999). Case studies are the preferred strategy for questions involving “how” and “why,” when the researcher has little control over events, and when the focus is on a contemporary phenomenon that is part of a real-world context (YIN, 2015).
In our research, the unit of analysis is the “transaction” between small producers of organic fruits and vegetables and their buyers who utilize several different distribution channels (multiple channels). The case study was conducted on five small organic fruits and vegetable properties in Northern California, through individual interviews with a predefined set of questions. Key components of the analysis included describing and understanding the complexity of transactions from the perspective of the organic producers and identifying the dynamics of trade relations, especially as they relate to producers’ profitability. This level of analytical depth made it possible to understand the particularities of some of the sales channel structures in terms of value capture and to determine why there is the perception of different value capture for the same asset sold through different channels.
Results and discussion
To better understand and discuss the results, a summary table of the main research results (Table 1) was prepared. It includes the following elements that are essential to data analysis: the primary and secondary sales channels, the volume allocated to these channels, the specificity of assets, investments, price determination, the resale price (when applicable), and completion of transactions. It is important to note that this information was collected from rural producers and that the results were therefore interpreted through the producers’ perceptions of their transactions with their main sales channels.
Overview and characteristics of the properties
Five small properties were examined in this study. They range between nine and 23 acres. All of the properties employ family labor with one exception (property 3), which produces grapes for winemaking and acquires most of the raw material needed from other producers.
The properties are all located in Northern California, specifically, in three counties south of the San Francisco Bay, San Benito, Santa Clara, and Santa Cruz counties. The seasons in this region are well demarcated, with typically light to moderate rainfall in winter and spring, and extremely dry summers and falls. The mild temperature for most of the year favors fruits such as strawberries and blueberries and vegetables such as lettuce and artichokes. Additionally, the soil in this region is rich in nutrients. In recent years, this region, as with all of California, has faced one of the worst droughts in recent years. As such, some farmers needed to dig wells to meet the demand for water in their production.
To describe the farms, they were numbered from 1 to 5. Of the properties surveyed, one grower produced only vegetables (property 4), two produced only fruit (properties 2 and 3), and two produced both fruit and vegetables (properties 1 and 5). Property 3 produces grapes for winemaking on its own property.
Between 2012 and 2014, all of the vegetable properties expanded their land to increase production. However, the fruit-producing properties either reduced or maintained their area. One of them, property 2, suffers from water scarcity; although it produced vegetable crops in the past, it now produces only fruits that require less water for irrigation. Another property, property 3, maintained production and has no additional land available to increase production. In parallel to the increase in production on the properties, the production costs related to labor and supplies also increased between 5% and 15% in the period between 2012 and 2014. It is important to note that because labor tends to be scarce in rural areas, agricultural labor tends to be relatively expensive.
We observed that it was common for producers to be members of at least one association. For example, all of the growers who produced vegetables that sell at farmers’ markets belong to an association because membership is required in order to sell at the market. Additionally, two fruit producers (property 2 and 3) belong to an association that uses marketing campaigns to promote the consumption of local products. Producers selling through farmers’ markets must pay annual membership fees, booth rental, and obtain and maintain proof of organic certification and sanitary inspection in each county in which they sell.
Between 2012 and 2014, producers reported increased income of between 2% to 5%. However, they stated that their income remained the same due to investments made in their properties. Growers also made note of the cost of complying with government regulations. For example, certification and insurance, which are provided for in regulations on the production of organic and rural products, are requirements for selling through all distribution channels.
Table 1 – Summary of the results
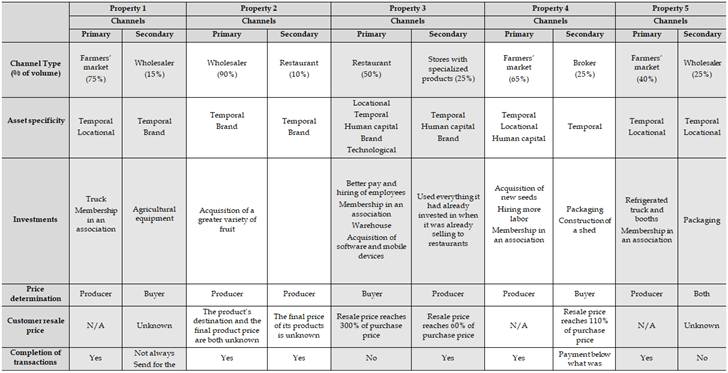
Source: Prepared by the authors
Case Studies
Property 1
The principal sales channel used by Property 1 is farmers’ markets with 75% of the production volume. During the main production season, Producer 1 uses five farmers’ markets per week; outside the main season, sales are made through only two farmers’ markets each week. The farmers’ markets are located near the farm in two different counties. Several family members are involved in production and marketing activities.
Because organic foods are a perishable product, the speed of distribution and proximity of production to the distribution channel are important. In the case of Producer 1 it was necessary to purchase a truck to transport the produce. This investment was made with the producer’s own resources. Farmers’ markets aim to provide consumers with all of the necessary fruits and vegetables; if consumers don’t find what they are looking for they will purchase their produce elsewhere. Because of this providing a variety of different products was identified as an important factor.
Because the grower sells directly to the consumer, the producer establishes the price; however, the producer specifies his product taking into account the market price. For example, the average price at farmers’ markets in San Francisco can be up to double the price at farmers’ markets in other counties. Payment is made at the time of purchase.
Producer 1 sells approximately 15% of his production to a wholesaler because he cannot sell the entire volume at farmers’ markets. Selling into the wholesale channel entails meeting additional requirements that producers must meet. A typical wholesale contract, which lasts one season, will include the following requirements to be met by the producer: price, quantity, quality, transportation (from the producer), no resale of products from other producers, and brand. The producer must register a brand for its product to be sold to a wholesaler, making it a highly specific asset for this transaction.
To maintain this relationship, the producer must make investments in his property, which typically entails the purchase of agricultural equipment at the producers’ expense. These requirements are established by the wholesaler and the price, which is usually substantially lower than that of farmers’ markets, is not negotiated. To illustrate, one pound of tomatoes is typically sold for $4.00 at the farmers’ market and $1.50 to the wholesaler.
Property 2
The proprietor of Property 2 sells approximately 90 percent of his produce through a wholesaler located in the same county as his farm. Although there is no explicit contract, there is an informal agreement based on the long-term relationship between the parties and the purchase and sale loyalty that exists between the farmer and the buyer. However, prices and quantities are negotiated with each transaction.
The grower indicated that there are several requirements to successfully sell to the wholesaler. It is necessary for the producer to have a brand, a variety of products, efficient communication with the buyer, and quick delivery of the product. The farmer also had to make an investment in registering a brand to comply with the wholesaler’s requirements. The product price is set by the producer, and there is some variation above or below the market price. A total of 90 percent of the Property 2’s production volume is intended for this wholesaler. The grower reports that he does not know the final price that the end consumer pays.
Approximately 10% of proprietor 2’s production is sold to restaurants. There is also no contract required for this channel. However, the restaurants require evidence of the proper certifications and a product brand. Successfully serving the restaurant market require rapid product delivery, efficient communication, providing adequate transportation, a product brand, and a variety of products. In the case of proprietor 2, the producer had already met these requirements and not additional were needed. Although transportation is not the necessarily the producer’s responsibility, providing transportation gives the grower a competitive advantage. In this case the grower receives a payment of 5% of the value of goods sold ($5 for each $100 of goods sold). In order to better meet the restauranteurs’ needs, this producer increased variety of his fruit trees. The product price is determined by the farmer. Although the farmer determines the price it is typically set at the market price for product sold through this channel. The price is usually lower than the wholesale price, typically 10% less than the wholesale price or lower.
Property 3
Restaurants are the main customers for Property 2, accounting for 50% of production volume. The proprietor makes weekly efforts to sell his products to several local restaurants. He is grows winegrapes and is a vintner. He maintains close contact with his customers, which is important because it reinforces the quality of his product and helps to differentiate his product from that of other suppliers. The producer is responsible for transporting the product and for this purpose has rented a warehouse.
To maintain his relationship with restaurants, the winegrower considers quick delivery of the product to be essential. Although the product is not perishable, it is important to meet the needs of this specific type of client. Because restaurants often do not have adequate space to store large inventories, they prefer to purchase products on a frequent, sometimes daily, basis. This can be a difficult requirement to meet and occasionally the vintner has lost sales because he was unable to make the frequent deliveries.
To sell through this channel, the certificate authorizing the sale of alcoholic beverages is the principal requirement. Although the product is certified organic and carries an organic label, this information is not recognized by its customer or valued as such. However, the producer maintains the organic product certification due to philosophical reasons and to be prepared for possible changes in the market.
Three elements are important for maintaining relationships with restaurants: brand, packaging, and efficient communication. For this last requirement, the winegrower has invested resources in software, mobile phones, and marketing. All investments in the farm and facilities are made with the grower’s own resources. The only government resource that was utilized by the farmer was the subsidy for organic certification.
Price is determined by the buyer and the producer believes that it is always above the market price. Because the product can be stored for long periods of time, the producer is not pressured to sell it at any price, which allows the producer flexibility in the timing of sales and allows him to receive more value for his production. Nonetheless, the restaurants typically sell this product at about 300% of the their purchase price.
The second largest sales channel for property 3 is a network of specialized stores. Producer 3 sells to a large network of stores that specialize in natural, functional, and ecological products, including Whole Foods Market. This channel represents approximately 25% of his production volume.
The producer was not required to make additional specialized investments to access specialty stores because he already had the necessary structure in place before initiating began transactions through this channel.
The product price is determined by the producer, and it is the price on the market. The customer’s profit margin is about 60% of the purchase price.
Property 4
Property 4’s owner sells the majority of her produce at five farmers’ markets (65% of total). They pay an annual membership fee of $200 to three associations. These associations organize farmer´s markets. There is a formal agreement (contract) between the parties, which includes prerequisites and requirements with which the producer must comply[3]. There are only two people involved in the production and marketing of the products. To meet the needs of consumers who go to farmers’ markets, the producer had to make investments in the property, acquiring new seeds and hiring two employees. Because of its proximity to the consumer, this channel allows the producer to develop an excellent understanding of their needs. The producer routinely adjusts crop plantings to deliver the type, quality, and quantity of produce based on consumer intelligence. The county certification, which the producer did not have before beginning an sales at farmers’ markets, was also a necessary investment.
According to the producer, selling at farmers’ markets has taken up a considerable amount of her time. There is often surplus production, which is sold to restaurants at a steep discount or sold or donated as animal feed.
The secondary sales channel for Producer 4 is an intermediary or broker. This channel has become important for the producer due to the increase in production volume and the growth in losses due to excess product previously directed to farmers markets. Furthermore, sales through a broker are a good complement to the highly variable farmers’ markets sales. The production volume that allocated to this channel is 25%.
The broker acts as an agent who sells the producer’s products at a commission of 10% of the product’s sale value. The producer must pack, ship, and transport the produce. This necessitated the acquisition of crates and pallets. There is also a minimum volume required by the broker of 10 boxes per variety. The quality and quantity are evaluated by the broker, who can accept or reject the products.
In order to develop the broker sales channel the producer needed to make investments in her property, including constructing a shelter and adding packaging equipment in order to accommodate and handle products sold through the broker channel.
Proprietor 4 has encountered some difficulties in working with the broker. In several instances there were products that were rejected for resale. In another instance cherry tomatoes that were to be sold at the agreed-upon price of $25 were sold by the broker for $9. According to the broker, this was due to low product quality.
The price is determined by the broker, who pays between $1.00 and $2.00 per pound, depending on the time of year. According to the producer, the resale price of its product by the broker is 110% of the purchase price, and it can take up to two months to receive payment.
Property 5
The producer on Property 5 sells most of his products (40% of the total production volume) at two farmers’ markets in his own county in the municipality of San Jose. The annual membership fee for the association that manages this channel is $100, in addition to a payment of $25 every Saturday and $75 every Wednesday, which covers renting the space and booths.
To access this market, the producer has made several investments, including buying a refrigerated truck and a table to display the product. These investments were necessary in order to maintain product quality and to properly present the product to potential customers. These investments were financed with a bank loan.
The association that manages the farmer’s markets wants to ensure that the consumer has the opportunity to purchase a variety of products at a single site, and therefore, the association asks producers to have a wide variety of produce items. Producer 5 has invested in new product varieties and, in addition to selling natural products, is also planning to develop a processed goods line, with products such as pickles. This will enable him to sell value-added products and offer greater product choices to consumers. The product line expansion has come at a cost as the producer had to purchase a refrigerated truck and cooler. The investments were made using the producers own resources and a bank loan.
The price is determined by the producer, which, according to the producer, is above the price that would be received through other channels.
The producer on Property 5 allocates approximately 25% of his production to a wholesaler located in another county (San Francisco).The products must be packaged and the wholesaler gives priority to those growers who can offer a wide product variety in making purchase decisions. The wholesaler has warned that it will soon require two certificates: food safety certification and GLOBALG.A.P.
Negotiations occur weekly, and the price is also negotiated jointly between the the producer and the wholesaler. According to the producer, price is generally set at approximately 10% below the going market price. Payment is typically received about one month after delivery.
There is no commitment between the wholesaler and the producer as the relationship between them is still very new (only one year). At about the time of the interview, the wholesaler stopped purchasing the producer’s products. The producer is exploring selling his products to other wholesalers (at the same price offered by the previous wholesaler) as well as selling additional product through his main channel (farmers’ markets), where the price is higher.
Comparative summary of the case studies
In the first case (Property 1), we have a producer who sells at farmers’ markets (85% of production volume) and to a wholesaler (15% of production volume). The transaction costs associated with selling to wholesalers are significantly higher than those associated with selling through farmers’ markets. To sell to wholesalers, significant investments are necessary in assets (brand and temporal) that are not necessary when selling to farmers’ markets. Although the per unit profit is lower when selling to wholesalers, the producer uses this channel it to sell product that cannot be sold through farmers’ markets. In this way the producer may produce product that he hopes will sell at the higher price available at farmers’ markets but still have an outlet for unsold excess product, albeit at a lower profit.
Property 2’s producer sells the bulk of his organic fruit production (90%) through a wholesaler. He added a second channel (restaurant) five years ago and now sells 10% of his production to a restaurant. Both channels have the same requirements for the producer: brand and product variety. The investments made with his own resources were only to plant new product varieties, i.e., no investments were made that would indicate that the producer has a high risk with regard to residual ownership rights. The price established for the product is determined by the producer, but it is based on the market price for organic products. Prices for product sold to restaurants are slightly higher compared to the wholesale channel. Because the largest volume is intended for the wholesaler, who has additional requirements for purchasing products, and the producer is pressured to price the product attractively for this channel, it is clear that residual ownership rights reside with the wholesaler.
In the third case (Property 3), restaurants, which are the producer’s primary channel, are responsible for purchasing 50% of its production, and natural product stores are responsible for purchasing 25% of its production volume. Our analysis indicates that the restaurant channel demands greater investment from the producer/vintner. These investments are focused on wine production and marketing and will require even greater investment to establish its brand in this channel. It is important to note that the sales price through both distribution channels is the same for the different categories of wine. Despite adding value to its agricultural products (grapes), the restaurants end up appropriating the product’s value during the transaction; they do not purchase the product as organic because this attribute is not valued by restaurants, but they sell it in their establishments at prices that reach 300% of the producer’s purchase price. In the network of specialized stores (Whole Foods Market), the producer sells 25% of his production and does not need to make investments to access this channel, since these investments were made previously to serve the restaurant channel. The costs incurred ex ante for these transactions (searching for customers, marketing efforts, and negotiations) with restaurants are greater compared to the network of stores, and it is evident that, among these channels (whole foods market and restaurants), restaurants end up capturing greater value in the transaction than producer.
For Property 4, the principal distribution channels are farmers’ markets (65%) and brokers (25%). Over the course of the year, the economic returns are much higher, roughly double, for sales through farmers’ markets as compared to broker sales. However, when the producer sells to an intermediary, he has no expenses for membership in associations and renting booths, though he had to make investments in packaging, pallets, and physical structure. There is no doubt that the producer captures greater value at farmers’ markets since she is able to sell his produce directly to consumers at a much higher price with little additional expense relative to broker sales.
In the last case (Property 5), there is a clear advantage to using farmers’ markets rather than the wholesaler in terms of value capture. However, it is important to note that the producer did not need to make specific investments to serve the wholesaler, which actually functions for the producer as an important channel to sell excess products. The annual average sales price of certain products, such as melons, is up to five times higher at farmers’ markets as compared to sales to the wholesale price. Moreover, costs for selling through the farmers’ market are only slightly higher than the costs associated with selling through a wholesaler. This is because the largest expense for selling through the farmers’ market is transportation, which is a small expense since the farmers’ markets are close to the grower’s property. The producer also indicated that the wholesaler will soon require two more certificates. If this requirement actually goes into effect, selling through the wholesaler may no longer be a viable option for the producer, particularly if the wholesaler does not recognize the producer’s investments, which make the asset highly specific. Thus, because the residual rights remain with the producer, the farmers’ markets, which are already a more attractive channel for the producer, will become even more important in future transactions.
Summary and conclusions
In all of the cases researched in this study and as indicated by the international literature (STERN et al., 1996; ROSEMBLOOM, 1999; MACINNIS, 2004; GIUCA, 2013; BRUNORI, 2007), when business transactions are made through direct channels, they provide greater benefits to the supplier, such as increased income and consumer perception of product attributes relative to transactions made through indirect channels.
Among the channels that are used by producers, the farmers’ market, a direct sales channel, provides the producer with the greatest advantages in relation to the investments made for specific assets. Distributors, such as wholesalers and brokers, capture the most value among indirect channels. For producers to access these channels they must make significant investments and they tend to allocate a lower production volume of their products (except Producer 2). A majority of the quasi-rent remains with the intermediaries. When no investments are made to access these indirect channels, restaurants become a potential channel for producers to sell their surplus production. However, restaurants apparently do not value the attributes of organic products and local products when purchasing them, despite exploiting these attributes when selling to the end consumer. In this case, it is clear that restaurants capture much of the product’s value, not the producer. It should be noted that the two producers who sell to restaurants are associated with an association that promotes local products but does not issue any local product certificates or label for the products. The creation of such a certificate or label could allow producers to leverage their products unique characteristics in the negotiations with restaurants.
The greater the proximity to the end consumer, the greater the chances are that the consumer will recognize the supplier’s investments (SAES, 2008). Thus, when selling to intermediaries (wholesaler, broker, and restaurants), the added value is not captured by those who made the necessary investments because the product’s requirements will be valued at the end of the chain. Thus, there is pressure to lower product prices, losing efficiency of transaction by the producer and product value. By selling directly to the consumer (farmers’ markets), the importance of the product requirements is more easily recognized and valued by the consumer, and therefore, the producer captures more of the product’s value as a return to the investments made (contract, transportation, certification, packaging, brand).
Although direct selling is the best alternative for the distribution of products, in terms of better remuneration (WANG; MOUSTIOR; LOC, 2003; GIUCA, 2013), there are some obstacles that do not allow the producer to use only this channel to distribute his or her products. One of the problems is related to the difficulty of accessing some of these direct channels, such as farmer's markets, since the competition for a vacancy is very fierce. Another important problem concerns the difficulty for producers in reconciling distribution activities with production activities. Because distribution through direct sales is so time consuming, producers must carefully evaluate the tradeoffs between the costs and benefits of direct sales, indirect sales, and production activities.
Property 4 provides a good example of the tradeoff that many small organic growers must consider. Only two family members (a couple) are involved in the production and marketing activities. In this case, direct marketing becomes impracticable since it is not possible to reconcile such activities with the production demands of their farm. To do so would require hiring additional labor. However, the laborers with the required skills are increasingly scarce in rural areas and expensive for small producers. Policies that would promote increased access to farm labor would benefit small growers by allowing them to invest in labor-intensive activities, such as direct marketing. They could benefit both growers and communities by increasing incomes.
Acknowledgements
The authors would like to thank Capes (Coodernação de Aperfeiçoamento de Pessoal de Nível Superior) for funding the research project developed in 2014-2015 and the California organic growers who took the time to participate in the interviews. The authors also thank the Food and Agribusiness Institute in the Leavey School of Business at Santa Clara University, which hosted the lead researcher while conducting the research.
Bibliographic references
AZEVEDO, P. F. de. Nova economia institucional: referencial geral e aplicações para a agricultura. Agricultura São Paulo, v. 27, n. 1, p. 33-52, 2000.
BARZEL, Y. Measurement cost and the organization of markets. Journal of Law & Economics. Chicago, v. 25, p. 488-500, 1982.
BRAGA JUNIOR, S. S. et al. A preocupação ambiental é transformada em intenção de compra. Revista de Gestão Ambiental e Sustentabilidade, São Paulo, v. 2, n. 1, p. 3-27, 2013. Disponível em: http://www.revistageas.org.br/ojs/index.php/geas/article/view/37.
BRAGA JUNIOR, S. S.; SILVA, D. A relação da preocupação ambiental com compra declarada para produtos verdes no varejo: uma comparação da percepção do indivíduo com sua percepção de sociedade. Perspectivas em Gestão & Conhecimento, v. 3, n. 2, 2013. Disponível em: https://periodicos.ufpb.br/ojs/index.php/pgc/article/view/15935.
CANTOR, A.; STROCHLIC, R. Breaking down market barriers for small and mid-sized organic growers. USDA Agricultural Marketing Service, United States of America, 2009.
CUNHA, C. F.; SAES, M. S. M.; MAINVILLE, D. Y. Análise da complexidade nas estruturas de governança entre supermercados e produtores agrícolas convencionais e orgânicos no Brasil e nos Estados Unidos: a influência do custo de transação e de mensuração. Revista de Administração, São Paulo, v. 48, n. 2, p. 341-358, 2013. Disponível em: http://www.scielo.br/scielo.php?pid=S0080-21072013000200012&script=sci_abstract&tlng=pt.
DIMITRI, C.; OBERHOLTZER, L. Using vertically coordinated relationships to overcome tight supply in the organic market. Economic Research Service, USDA, 2008. Disponível em: https://www.ers.usda.gov/webdocs/publications/39515/11304_vgs32901.pdf?v=41056.
ELDER, S. D.; LISTER, J.; DAUVERGNE, P. Big retail and sustainable coffee: a new development studies research agenda. Progress in Development Studies, v. 14, p. 77-90, 2014. Disponível em: https://journals.sagepub.com/doi/full/10.1177/1464993413504354.
FARINA, E. M. M. Q.; AZEVEDO, P. F.; SAES, M. S. M. Competitividade: mercado, estado e organizações. São Paulo: Singular, 1997.
GIL, A. C. Métodos e técnicas de pesquisa social. 5. ed. São Paulo: Atlas, 1999.
GONZÁLEZ, A. A.; NIGH, R. Smallholder participation and certification of organic farm products in Mexico. Journal of Rural Studies, v. 21, n. 4, p; 449-460, 2005. Disponível em: http://linkinghub.elsevier.com/retrieve/pii/S0743016705000690. Acesso em: 4 nov. 2014
GIUCA, S. Understanding the short chain. In: GIARÈ, F.; GIUCA, S. (Eds.). Farmers and Short Chain: legal profiles and socio-economic dynamics. Istituto Nazionale di Economia Agrária – INEA, 2013. p. 11-27. Disponível em: http://156.54.184.84/handle/inea/770.
GUIVANT, J. S. Os supermercados na oferta de alimentos orgânicos: apelando ao estilo de vida ego trip. Ambiente & Sociedade, v. 6, n. 2, p. 63-81, jul. 2003. Disponível em: http://www.scielo.br/scielo.php?pid=S1414-753X2003000300005&script=sci_abstract&tlng=pt.
FIBL-IFOAM (Forschungsinstitut für Biologischen Landbau – International Federation of Organic Agriculture Moviment). The world of agriculture organic. Statistics and emerging trends, 2010. Disponível em: https://www.organic-world.net/fileadmin/documents/yearbook/2010/world-of-organic-agriculture-2010.pdf. Acesso em: nov. 2014.
FIBL-IFOAM (Forschungsinstitut für Biologischen Landbau – International Federation of Organic Agriculture Moviment). The world of agriculture organic. Statistics and emerging trends, 2012. Disponível em: https://www.organic-world.net/fileadmin/documents/yearbook/2012/fibl-ifoam-2012-summary.pdf .
FIBL-IFOAM (Forschungsinstitut für Biologischen Landbau – International Federation of Organic Agriculture Moviment). The world of agriculture organic. Statistics and emerging trends, 2015. Disponível em: https://www.organic-world.net/yearbook/yearbook2015.html.
KLEIN, B.; CRAWFORD, R. G.; ALCHIAN, A. A vertical integration, appropriable rents, and the competitive contracting process. The Jornal of Law & Economics, v. 21, n. 2, out. 1978.
KRISCHKE, P. J.; TOMIELLO, N. O comportamento de compra dos consumidores de alimentos orgânicos: um estudo exploratório. Cadernos de Pesquisa Interdisciplinar em Ciências Humanas, v. 10, n. 96, 2009. Disponível em: https://periodicos.ufsc.br/index.php/cadernosdepesquisa/article/view/1984-9851.2009v10n96p27.
KLONSKY, K. A Look at California’s Organic Agriculture Production. ARE Update, University of California – Giannini Foundation of Agricultural Economics, v. 14, n. 2, p 8-11, 2010. Disponível em: https://giannini.ucop.edu/publications/are-update/issues/2010/14/2/a-look-at-californias-org/.
MACINNIS, Transaction Costs and Organic Marketing: Evidence from U.S. Organic Produce Farmers. 2004 American Agricultural Economics Association, Denver, Colorado, aug. 1-4, 2004. Disponível em: https://ideas.repec.org/p/ags/aaea04/20386.html.
OBERHOLTZER, L; DIMITRI, C.; GREENE, C. Adding value in the organic sector: characteristics of organic producer-handlers. Renewable Agriculture and Food Systems, v. 23, n. 3, p. 200-207, 2008. Disponível em: https://www.cambridge.org/core/journals/renewable-agriculture-and-food-systems/article/adding-value-in-the-organic-sector-characteristics-of-organic-producerhandlers/B6ADC5266C284FE6B1148B7DCDEC2B75.
RICHARDSON, R. J. Pesquisa Social – Métodos e Técnicas. 3. ed. São Paulo: Atlas, 2008.
ROSEMBLOOM, B. Marketing Channels: a management view. Orlando: The Dryden Press, 1999.
SAES, M. S. M. Estratégias de diferenciação e apropriação da quase-renda na agricultura: a produção de pequena escala. São Paulo: Universidade de São Paulo, 2008.
SAES, M. S. M. A distribuição de quase-renda e a estratégia de diferenciação no café. Revista de Administração Contemporânea, v. 11, n. 2, p. 151-171, 2007. Disponível em: http://www.scielo.br/scielo.php?script=sci_arttext&pid=S1415-65552007000200009.
SOUZA, R. F. Canais de Marketing, Valor e Estruturas de Governança. RAE – Revista de Administração de Empresas, v. 42, n. 2, p. 42-53, 2002. Disponível em: http://www.scielo.br/pdf/rae/v42n2/v42n2a04.
STERN, L. W.; EL-ANSARY A. I.; COUGHLAN, A. T. Marketing channels. Englewood Cliffs: Prentice-Hall, 1996.
UNITED STATES DEPARTMENTE OF AGRICULTURE – USDA. Sales from U.S. Organic Farms Up 72 Percent, USDA Reports. Disponível em: https://www.nass.usda.gov/Newsroom/archive/2015/09_17_2015.php.
USDA AGRICULTURAL MARKETING SERVICE. Number of Operating Farmers Markets 2009. Disponível em: http://www.ams.usda.gov/.
VORLEY, B.; FOX, T. Global Food Chains – Constraints and Opportunities for Smallholders. The OECD DAC POVNET, Agriculture and Pro-Poor Growth Task Team, Helsinki Workshop, 17-18 jun. 2004.
YIN, R. K. Estudo de Caso – planejamento e métodos. 5. ed. Porto Alegre: Bookman, 2005.
WANG, H.; MOUSTIER, P.; LOC, N. T. T. Economic impact of direct marketing and contracts: the case of safe vegetable chains in northern Vietnam. Food Policy, v. 47, p. 13-23, 2014. Disponível em: https://www.sciencedirect.com/science/article/pii/S0306919214000669.
WILLER, H.; KILCHER, L. (Eds.). The World of Organic Agriculture - Statistics and Emerging Trends 2010. Bonn: IFOAM/Frick: FiBL, 2010.
WILLIAMSON, O. E. The economic institutions of capitalism. Oxford: Oxford University Press, 2010.
SCALCO, Andréa Rossi; BAKER, Gregory A. Value capture analysis of small organic growers and their distribution channels in California. Estudos Sociedade e Agricultura, v. 27, n. 3, p. 566-589, out. 2019.
Abstract: (Value capture analysis of small organic growers and their distribution channels in California). The United States has recorded strong growth in organic produce, as measured both by arable land devoted to organics and the value of the organic products market. Among the countries that produce such products, it is the third largest country in terms of arable land devoted to organic production. Furthermore, the U.S. has the highest consumption of organic products. The decision made by small producers when choosing which sales channels to access is a complicated issue. In California, the state with the largest amount of land used for organic farming, small organic producers use between two and four distribution channels to sell their products. The principal objective of this article is to identify the extent to which the main distribution channels used by producers to sell their products result in value capture by the producer or its distribution channels. The study finds that producers concentrate their sales in channels where they capture the most value and use secondary channels to dispose of product that cannot be readily sold through priority channels. Furthermore, producers use direct sales channels, such as farmers’ markets – despite the highly specific assets involved in this transaction due to the large investments needed to access them – because they provide the greatest return in terms of product value among the various distribution channels.
Keywords: organic; produce; value capture; distribution channels; supply chain.
Resumo: (Análise de Captura de Valor de pequenos produtores orgânicos e seus canais de distribuição na Califórnia). Os Estados Unidos registraram um forte crescimento na produção produtos orgânicos, medido tanto por terras aráveis dedicadas a produtos orgânicos quanto pelo valor do mercado de produtos orgânicos. Entre os países que produzem esses produtos, é o terceiro maior em termos de terras aráveis dedicadas à produção orgânica. Além disso, os EUA têm o maior consumo de produtos orgânicos. A decisão tomada pelos pequenos produtores ao escolher quais canais de vendas acessar é uma questão complicada. Na Califórnia, estado com a maior quantidade de terra usada para agricultura orgânica, pequenos produtores orgânicos usam entre dois e quatro canais de distribuição para vender seus produtos. O principal objetivo deste artigo é identificar até que ponto os principais canais de distribuição usados pelos produtores para vender seus produtos resultam na captura de valor pelo produtor ou por seus canais de distribuição. O estudo constata que os produtores concentram suas vendas em canais onde capturam maior valor e usam canais secundários para escoar produtos que não podem ser facilmente vendidos através de canais prioritários. Além disso, os produtores usam canais de vendas diretas, como os mercados dos agricultores – apesar dos ativos altamente específicos envolvidos nesta transação, devido aos grandes investimentos necessários para acessá-los – porque fornecem o maior retorno em termos de valor do produto entre os vários canais de distribuição.
Palavras-chave: produção orgânica; captura de valor; canais de distribuição; cadeia de suprimentos.
Recebido em março de 2019.
Aceito em julho de 2019.